After every technology investment, a factory owner needs a practical answer to an important question: Has the technology helped improve performance and achieve the organization’s goals, or has it added a new cost with no clear return? Impressions or general reports are not enough to answer it; you need to rely on factory KPIs that can be measured and analyzed.
Factory KPIs help management compare results with goals and understand the impact of digital transformation on production, quality and cost. They are an important tool for data-driven decisions, not a standalone verdict on the success of an investment.
As Saudi factories adopt technologies such as IoT, SCADA and MES systems, performance measurement has become part of daily work. The data flowing from production lines only delivers real value once it is turned into clear indicators, and then into decisions and actions that can be followed up.
The importance of this framework lies in its ability to identify deviations early and to link each indicator to a specific business goal, such as reducing downtime, raising product quality or increasing output. In this way, digital transformation shifts from a technology project into a process of continuous improvement.
Key Points
- Measuring digital transformation relies on key performance indicators linked to specific goals.
- Indicators show the difference between raw data and interpretable results.
- IoT, SCADA and MES systems help put data to use at the right time.
- Regular measurement reveals the impact of technology on production, quality and cost.
- Indicators support evidence-based operational decisions rather than guesswork.
- Continuous analysis turns results into practical opportunities to improve performance.
1. What Are Key Performance Indicators in the Age of Digital Transformation?
Key performance indicators, or KPIs, are numerical measures an organization selects in advance to track the achievement of operational or strategic goals. An indicator differs from raw data: data might be the number of units or hours of downtime, while an indicator explains what those numbers mean when compared with a target, a time period or another production line.
Building indicators therefore starts by defining the goal, then choosing the measurement method, the data source and the acceptable performance limits. A production rate indicator measures how close you are to plan, a defect indicator measures quality level, and a downtime indicator may measure operational stability.
Measuring digital transformation is not limited to production volume. It also covers the integration of systems such as ERP and MES, the speed at which information arrives, data accuracy, and management’s ability to make effective decisions. The more clearly an indicator is tied to a goal, the more useful it becomes.
To illustrate, imagine a Saudi plastic components factory that uses MES to monitor production lines and ERP to manage inventory and purchasing. When the two systems are connected, data on units produced and downtime becomes indicators that can be compared and analyzed. This is an illustrative example, not a documented study of a specific factory.
Performance indicators are usually divided into lagging indicators, which measure what happened, and leading indicators, which help anticipate what may happen. The two complement each other: results measure past performance, while leading indicators help you take preventive action before a problem escalates.
| Indicator type | Description | Practical example |
|---|---|---|
| Lagging indicator | Measures performance that has actually occurred, after completion | Actual monthly production rate |
| Leading indicator | Predicts a problem or opportunity before it occurs | Rising equipment temperature before a breakdown |
| Composite indicator | Combines current monitoring with future prediction | Overall Equipment Effectiveness (OEE) |
2. Why Do Saudi Factories Need to Measure Digital Transformation with Precise Indicators?
Saudi factories face challenges related to cost, competition and efficiency, so they need indicators that help them assess actual performance. No single list suits every company; priorities differ by sector, factory size and the nature of production operations.
Factors that can make measurement more important include:
- The need to manage energy and resource consumption efficiently
- Local, regional and international competition
- Vision 2030 targets for developing industry and raising competitiveness
Reliable data helps management justify technology investments, compare results before and after implementation, and discuss priorities with the board and financing bodies. This does not mean KPIs are a general condition for obtaining financing; rather, they provide evidence that helps present a project’s feasibility, risks and results.
The difference between an intuitive decision and a data-driven one shows in how quickly deviations are detected, how precisely waste is identified, and how fast corrective actions are carried out:
| Aspect | Factory relying on intuitive decisions | Data-driven factory |
| Detecting deviations | Late, often after the fault has occurred | Early, through real-time indicators |
| Resource waste | High and undocumented | Low and measurable |
| Decision speed | Slow and dependent on personal experience | Fast and based on accurate figures |
Organized records also help with audit readiness and better documentation when dealing with regulators or support programs. Most importantly, indicators should be reviewed periodically to make sure they remain linked to the factory’s goals, rather than collected simply to produce more reports.
3. Traditional vs. Digital Performance Indicators
Traditional industrial performance measurement relies on periodic reports compiled manually every month or quarter. Supervisors record figures in Excel files or paper logs, and the results reach management days or weeks later, by which time a problem may already have affected production, cost and quality.
This approach delays the detection of deviations in production rate or downtime and bases decisions on past data that does not reflect the factory’s current state. Digital key performance indicators, by contrast, use SCADA, MES and Industrial Internet of Things systems to collect and update data continuously.
Digital industrial efficiency indicators show changes in line speed, energy consumption and equipment status on a dashboard. However, real-time data does not automatically mean accurate data; systems need correct calibration, reliable sources and clear rules for validating data.
The following table shows the key differences between traditional and digital measurement in terms of update speed, accuracy of results and ability to respond:
| Item | Traditional measurement | Digital measurement |
| Data update speed | Weekly or monthly | Real-time and continuous |
| Data accuracy | Prone to human error | Sourced directly from connected systems |
| Response to deviations | After the problem occurs | Before the problem escalates |
| Decision-making style | Reactive to past figures | Proactive, based on live data |
Digital transformation is not just a change of measurement tool; it changes the culture of work and decision-making. Instead of waiting for a report, the team reviews the indicator, identifies the cause of the deviation, then chooses a corrective action and a date to follow up on its effect.
When management relies on digital performance indicators, it can analyze faults faster, not because the indicators prevent problems automatically, but because they provide information that supports early intervention. In this way KPIs shift from numbers for display to tools for improving performance.
4. The Most Important Industrial Efficiency Indicators to Track After Digital Transformation
An organization does not need to track dozens of measures at the start. A set of indicators linked to clear goals is enough to evaluate operational efficiency and the gap between planned performance and actual results.
This section focuses on three key indicators: OEE, unplanned downtime, and actual versus planned productivity, then moves on to the quality indicators that complete the assessment.
4.1 Overall Equipment Effectiveness (OEE) in the Factory
The factory OEE indicator (Overall Equipment Effectiveness) measures three elements together: availability, performance and quality. It therefore provides a composite picture of equipment use, but on its own it is not enough to judge a factory or to compare different lines that produce different products or operate in dissimilar conditions.
OEE can be used to compare periods or similar lines, provided the definitions of operating time, production speed and quality criteria are standardized.
4.1.1 How to Calculate OEE in Your Factory Step by Step
The formula is: OEE = Availability × Performance × Quality.
Take a hypothetical example from a Saudi filling plant:
- Availability: 90%
- Performance: 85%
- Quality: 95%
Multiplying the three ratios (0.90 × 0.85 × 0.95) gives approximately 72.7%. A figure of 85% is sometimes used as a common industry reference for a high level, but it is not a unified global standard for all factories and processes.
The availability factor measures equipment operating time against planned time, while performance measures actual operating speed against the approved ideal speed. Quality measures the share of good units in total output.
Improving just one OEE factor by only 5% can noticeably raise total productivity without buying new equipment.
4.2 Unplanned Downtime and Its Impact on Production
Unplanned downtime reveals operating losses and deviations from plan. A machine stoppage in a sequential process can halt the entire line, so the cause, duration and impact of each stoppage should be recorded rather than just the total hours.
The cost of downtime varies with the product, production capacity and fixed costs, so it should be calculated from the factory’s own data rather than from a general estimate. Root-cause analysis helps determine whether the right action is predictive maintenance, an operational adjustment or spare-parts availability.
4.3 Actual vs. Planned Productivity
This indicator compares what was planned to be produced with what was actually achieved, helping teams identify the least efficient line and take appropriate action.
| Production line | Planned output | Actual output |
| Filling line 1 | 10,000 | 9,200 |
| Filling line 2 | 8,500 | 8,450 |
| Filling line 3 | 12,000 | 10,300 |
Filling line 3 records output 1,700 units below target, or about 14.2% of plan. This analysis directs operations teams to review the causes of the gap, such as downtime, slow speed or quality issues.
Tracking these indicators together gives a more accurate picture of factory efficiency, because lower output may result from downtime, performance or quality, and not always from a single cause.
5. Quality Indicators and Defect Monitoring After Industrial Automation
Industrial automation supports continuous quality monitoring using computer-vision cameras and sensors. These tools do not completely eliminate manual inspection; verification and calibration remain necessary to ensure measurement accuracy and conformity of results with specifications.
Vision systems can detect defects in shape, size or weight, but their capability depends on lighting quality, system settings, sensor calibration and how a defect is defined.
Three indicators form the basis of digital quality assessment:
| Indicator | What it measures | Operational impact |
| DPPM | Number of defects per million units produced | Reveals subtle quality problems that manual sampling misses |
| Scrap Rate | Share of products rejected or reworked | Directly reflects material waste and costs |
| First Pass Yield | Share of products meeting specifications the first time | Measures the efficiency of the production process as a whole |
In an undocumented example of a Saudi food factory, the defect rate was reduced from 3% to less than 1% within six months after implementing an automated inspection system. Any result of this kind should be tied to a baseline, a measurement period and a clear data source, and then turned into a corrective action that can be followed up.
6. Predictive Maintenance Indicators and Their Impact on Operational Efficiency
Predictive maintenance aims to detect early signs of equipment deterioration, not to prevent failures with certainty. It relies on the actual condition of equipment rather than a fixed schedule alone, helping maintenance teams prioritize interventions and reduce unplanned downtime.
Industrial Internet of Things (IoT) sensors collect continuous data on production line performance, most notably:
- Vibration levels in motors and rotating equipment
- Temperature at sensitive operating points
- Electrical current draw as a possible indicator of overload
This data is analyzed to detect abnormal patterns that may indicate wear, overheating or a change in load. After the alert is verified, the maintenance team decides on the appropriate action, such as an inspection, replacing a part or scheduling the work at a time that does not affect production.
System performance is usually measured through Mean Time Between Failures (MTBF) and Mean Time To Repair (MTTR). Failures and the measurement period must be defined the same way when comparing results. A higher MTBF indicates a longer period between failures, while a lower MTTR indicates faster repair after a fault is detected.
| Indicator | What it measures | Operational impact |
|---|---|---|
| MTBF | Time between one failure and the next | Reflects equipment reliability and operational stability |
| MTTR | Time to repair a fault after detection | Measures maintenance team efficiency and response speed |
| Failure prediction accuracy | Share of failures successfully predicted in advance | Helps reduce sudden stoppages and emergency repair costs |
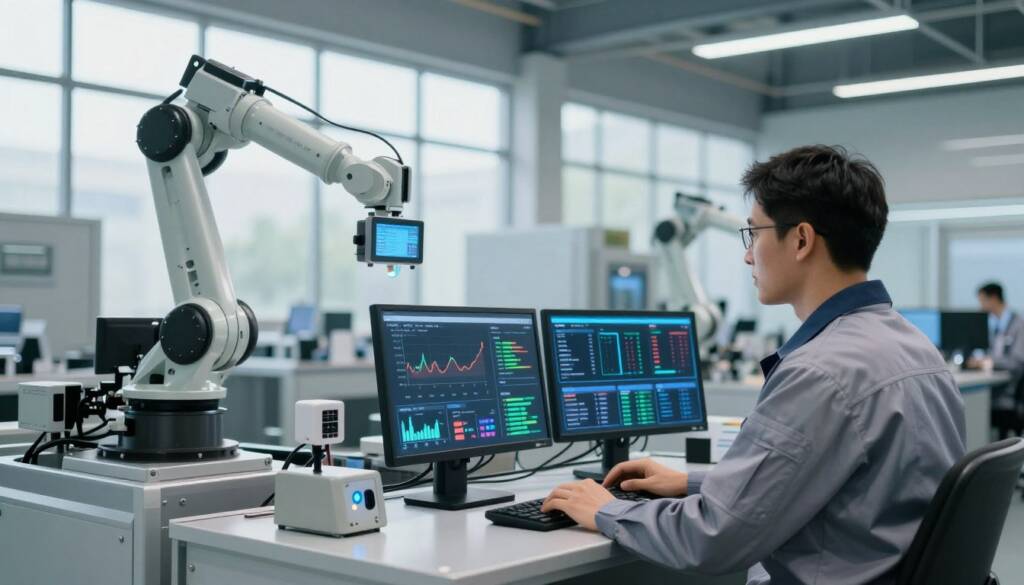
Tracking these indicators helps compare performance with a previous baseline and measure the effect of improvements over a defined period. If MTTR falls after spare parts are made available or the team is trained, the effectiveness of the action shows in the data; an alert on its own is not a result unless it is turned into a documented decision and action.
In a hypothetical teaching example of a cement plant in the Eastern Province, analytical models might reveal rising temperature in a main motor before a potential failure. This allows an inspection to be scheduled at a suitable time, but the value of the result depends on sensor accuracy, model validity and documentation of what actually happened.
The same idea applies to petrochemical plants and others: the cost of a sensing system should be weighed against the value of production at risk, rather than assuming every stoppage calls for the same technical solution.
7. Energy and Resource Consumption Indicators as a Tool for Measuring Sustainability
Energy and resource consumption indicators link operational performance with environmental impact and cost. Measuring total energy is not enough: consumption may rise as production increases, while the energy used per unit produced falls. A baseline, a comparison period and production volume must therefore be defined when interpreting results.
Efficient energy use is consistent with industrial sustainability trends and Vision 2030 targets, but the choice of indicators and target thresholds should reflect the factory’s activity and regulatory requirements. Management needs verifiable data to turn measurement into improvement decisions.
Key indicators include energy consumption per unit produced, known as Energy Intensity, as well as the waste rate of water or raw materials. These measures reveal opportunities to reduce losses and help assess the impact of changing operating settings or maintaining equipment.
| Indicator | What it measures | Operational impact |
|---|---|---|
| Energy Intensity | Energy consumed per unit produced | Lower cost and emissions while maintaining output |
| Water waste | Share of water wasted in operations | Better usage efficiency and less loss |
| Raw material waste | Material lost during manufacturing | Lower costs and higher resource efficiency |
Factories use smart meters and Energy Management Systems (EMS) to monitor consumption, then link the data to the shift, product and production line. Analysis supports decisions such as balancing load, fixing leaks or adjusting the operating schedule.
Any example of reduced energy consumption at a petrochemical plant should be presented either as a documented result or as a hypothetical example, stating the baseline, the period and the type of consumption. In this way energy indicators become a practical tool for measuring improvement, not numbers disconnected from reality.
8. Financial Performance Indicators Linked to Digital Transformation ROI
Evaluating digital transformation requires linking operational indicators to financial results. Return on investment (ROI) is usually calculated by dividing the net annual return or benefit by the total investment cost, then multiplying by 100. The cost should include hardware, implementation, integration, training and maintenance.
Other indicators help interpret the figure, such as cost per unit produced, net operational savings and payback period. They do not replace a full financial analysis, but they clarify where savings come from and how long it takes to recover the investment.
- Cost per unit produced: compares production cost before and after automation.
- Net annual operational savings: includes the effect of energy, waste, maintenance and downtime.
- Payback Period: defines the time needed to recover the value of the investment.
The following teaching example shows how data can be turned into a financial decision; it does not represent the results of a specific organization.
| Item | Value | Note |
|---|---|---|
| Investment size | SAR 2 million | Sensing systems and cloud connectivity |
| Annual savings | SAR 800 thousand | Less downtime and waste |
| Payback period | 2.5 years | Result of 2,000,000 ÷ 800,000 |
These results should be presented to the board in clear financial language, explaining the assumptions and implementation risks. Linking KPIs to cost and profitability helps decision-makers assess feasibility and decide whether the investment needs expansion, adjustment or review.
9. How Do You Link Industrial IoT Data to Industrial Efficiency Indicators?
Industrial efficiency indicators are built from a data chain that starts with sensors installed on production lines. These sensors capture temperature, vibration, speed and equipment status, and the readings travel to a gateway or local server before being stored and processed. After the data is checked for completeness and timing, it is turned into indicators that help management measure performance and make practical decisions.
This flow passes through several stages: a sensor captures the reading, a gateway aggregates it, a platform stores and analyzes it, and a dashboard displays the indicator, the alert and the required action. Real-time data is not automatically accurate; it requires calibration, standardized units, validation of readings and access-rights management.
| Component | Function | Practical example |
|---|---|---|
| Sensor | Captures actual readings from the machine | Vibration sensor on a production motor |
| Gateway | Aggregates and encodes data for transmission | Converts analog signals to digital |
| Analytics platform | Processes data and calculates indicators | Extracts the OEE rate automatically |
Using the OPC-UA and MQTT protocols helps exchange data between different devices and systems, but they do not guarantee compatibility automatically. The organization needs a suitable integration layer, a unified data definition and governance rules so that industrial efficiency indicators do not become delayed or incomparable.
On a metal production line, a temperature and vibration sensor might send its readings to a local server or cloud platform, and the data is then used to calculate OEE and downtime. The owner of each indicator should define how it is reviewed, its alert thresholds and the action that follows a deviation, rather than assuming automated analysis replaces the operations team’s responsibility.
This integration gives the plant manager a real-time view of machine performance, but data quality must be reviewed before relying on it. Once the cycle of sensing, analysis, alerting and decision is complete, factory KPIs become a tool for improving performance, not just another digital report.
10. Practical Steps to Build an Effective KPI System in Your Factory
Every factory has plenty of data, but its value appears when it is linked to a clear system that serves factory performance improvement. The methodology starts with defining goals, then selecting KPIs, assigning their owners, and defining the data source, measurement frequency and decision-making method.
The process goes through four interconnected stages, starting with setting priorities and ending with review and continuous improvement.
10.1 Define the Strategic Goals of Digital Transformation
Before choosing an indicator, you need to answer one question: what goal does the organization want to achieve? It may be lowering production cost, increasing capacity, improving quality or reducing resource consumption. A specific goal helps exclude numbers that do not serve the factory’s strategy.
“What gets measured gets managed”
This phrase underlines the importance of measurement, although the source of the quotation should be verified before using it in official material. A measurable goal is the foundation on which KPIs are built.
10.2 Choose the Right Indicators for Each Production Department
The indicators for a filling line differ from those for maintenance, quality and energy. You should therefore choose a limited number of performance indicators and assign responsibility for collecting them, analyzing them and following up on the resulting action.
| Area | Indicator | Goal |
|---|---|---|
| Production line | Actual productivity rate | Compare performance with the plan |
| Maintenance | Unplanned downtime | Reduce failure periods |
| Quality | Defect rate per batch | Control conformity to specifications |
| Energy | Electricity consumption per unit | Track resource efficiency |
This distribution gives each department manager trackable indicators and specific decisions, instead of general reports that do not clarify priority or responsibility.
10.3 Collect and Analyze Data Through Digital Dashboards
Next, the indicators are displayed on suitable dashboards. An organization may use Power BI, SCADA platforms or other tools depending on the nature of its operations. A distinction should be made between a real-time monitoring dashboard that shows machine status and a management dashboard that summarizes trends and supports evaluation and decision-making.
Good design does not mean displaying all the data; it means selecting critical indicators such as OEE and downtime rate, and showing the baseline, target, alert and action linked to each indicator.
10.4 Review and Update Indicators Regularly to Improve Factory Performance
Reviewing indicators every three months is not a mandatory rule but a recommendation that can be adjusted to how quickly operations and goals change. Some indicators may need daily review, while other strategic indicators suit monthly or quarterly review.
Regular review turns the KPI system into a continuous learning process and reveals whether the measures are actually helping with factory performance improvement and achieving goals, or need adjusting.
11. Tools and Technologies for Monitoring Factory KPIs in Real Time
Factories need tools that collect and display data according to business needs. MES systems provide production, quality and downtime data, while SCADA systems monitor equipment and machines. Cloud platforms may add analytics and cross-department comparison capabilities, depending on the configuration and version used.
| Tool | Type of data collected | Target group |
|---|---|---|
| MES | Production, quality and downtime data | Operations managers and production supervisors |
| SCADA | Real-time machine and equipment data | Maintenance and engineering teams |
| Cloud analytics platforms | Aggregated data from all departments | Senior management and decision-makers |
The choice of tool depends on the nature of operations, security requirements and team capability, not on factory size alone. A small factory may need limited integration, while another may need a central platform because of multiple lines or sensitive data.
Good integration helps compare performance, but access rights and data quality must be managed before expanding usage. The platform does not deliver improvement on its own; it needs a team that interprets the indicators, makes decisions and carries them out.
12. Common Mistakes When Measuring Digital Transformation Success in Factories
More performance indicators do not mean more accurate measurement. A useful indicator is one that is linked to a goal and has a clear data source, a defined owner and a known action threshold.
Among the most common mistakes when measuring digital transformation success:
- Too many indicators: tracking more than twenty or thirty indicators can distract management; the figures are hypothetical examples, not a general limit.
- No link to strategic goals: choosing indicators that do not serve the factory’s goals makes the analysis less useful.
- Neglecting to update indicators: measures can lose their relevance when the product, process or business priorities change.
- Poor sensor calibration: inaccurate readings lead to misleading decisions, however advanced the platform.
The following example illustrates two hypothetical approaches to managing KPIs:
| Factory | Number of indicators tracked | Result |
|---|---|---|
| Factory A | More than 30 indicators | Confused decisions and slow improvement |
| Factory B | 5 core indicators | Greater clarity and tangible results within a few months |
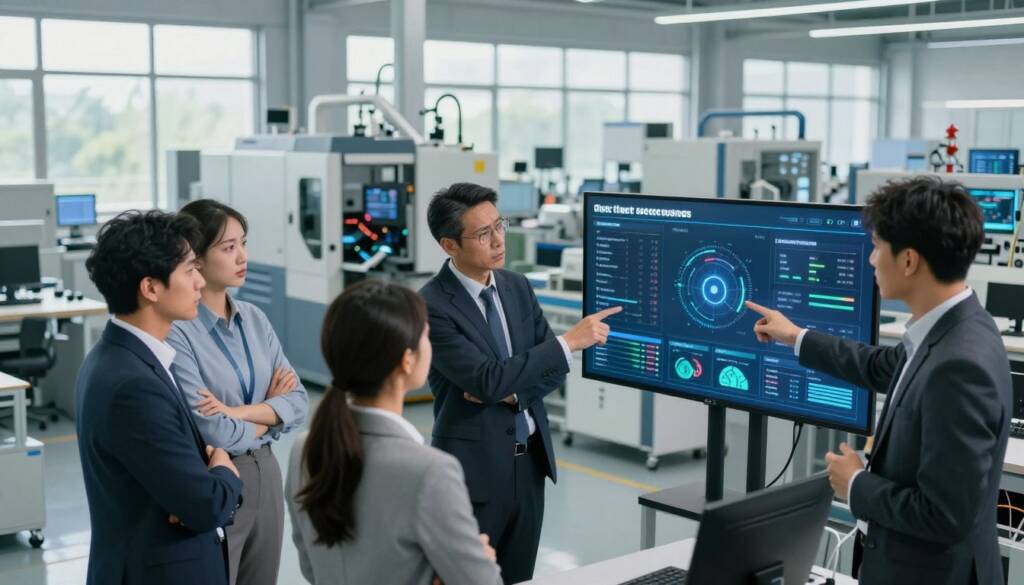
The point is not that five indicators suit every factory, but that relevance and the ability to act matter more than the number. Avoiding these mistakes requires data governance, periodic review and collaboration between operations, maintenance, quality and management.
13. Hypothetical Case Study: How a Saudi Factory Improved Its Performance Using Digital KPIs
In Riyadh’s industrial area, a hypothetical food-packaging factory began its digital transformation journey from a situation that relied on manual reports. This weakened tracking of actual performance: Overall Equipment Effectiveness (OEE) did not exceed 60%, with frequent stoppages whose causes were not precisely identified. The figures in this case are for illustration and are not a documented result for a specific factory.
Quality problems were discovered late, sometimes after the product had reached the customer, increasing inspection and return costs. To assess performance fairly, management set a baseline before implementation, then compared results after one year using a standardized collection method.
Management adopted a practical plan that included:
- Setting strategic goals to raise production efficiency and reduce unplanned downtime.
- Selecting KPIs such as OEE, defect rate and downtime.
- Installing sensors and connecting them to an MES platform to collect data continuously.
- Reviewing results weekly with production and maintenance teams and documenting corrective actions.
One year after implementation, the hypothetical comparison showed the following results:
| Indicator | Before digital transformation | After digital transformation |
|---|---|---|
| OEE | 60% | 78% |
| Unplanned downtime | High and undocumented | Down 35% |
| Operating profit margin | Low | Noticeable improvement |
| Early defect detection | Weak | Major improvement |
Numbers alone are not enough; their value appears when they lead to a decision and an action that can be followed up.
The case shows the importance of measuring the current state before investing, then evaluating performance after implementation over the same period and with consistent data sources. These figures do not mean every factory will achieve the same result; improvement depends on the nature of operations, data quality and teams’ ability to carry out decisions.
14. How to Interpret KPI Results to Make Continuous Improvement Decisions
Interpreting performance indicators is what separates a factory that collects data from one that uses it to improve performance. The process begins by comparing actual performance with the target, then defining the indicator owner, the alert threshold, the time frame and the required action.
A 2-3% deviation is not a general rule for intervening or not; it may be significant for quality or safety and immaterial for another indicator. The threshold should therefore be linked to its impact on cost, production and delivery.
Indicators can be classified by their financial and operational impact as follows:
| Priority level | Classification criterion | Required action |
|---|---|---|
| Critical | Direct impact on safety, cost or delivery | Immediate intervention within the same shift |
| Medium | Recurring deviation that does not stop production | Weekly review and a short corrective plan |
| Low | Slight fluctuation within acceptable limits | Periodic monitoring without direct intervention |
This classification directs resources to the most important problems and avoids flooding teams with details that do not support decision-making. Production, maintenance and quality teams should also be involved, because they understand the operational context behind the number and can test the cause of the deviation.
15. Conclusion
The success of digital transformation is not measured by the number of systems installed, but by management’s ability to use factory KPIs and turn data into operational decisions. The assessment covers OEE, quality, downtime, maintenance, energy and financial return.
The practical step starts with setting clear goals, then choosing five core indicators, or a number suited to the nature of the factory, assigning their owners and scheduling a regular review meeting. What matters is that the indicators are linked to goals and that the team is able to act, not the number alone.
The value of indicators appears when they lead to less downtime, higher productivity, better quality and lower energy and resource consumption. Decision-makers are therefore advised to review their factory’s indicators, assess how they link to strategy, and then define the first measurable action.
FAQ
Which Saudi factory KPIs should you start tracking immediately?
How is factory OEE calculated accurately?
Is measuring digital transformation limited to production performance?
What is the difference between traditional performance indicators and digital industrial efficiency indicators?
How many indicators suit a factory starting its performance improvement journey?
How does predictive maintenance help improve industrial efficiency indicators?
What is the relationship between energy consumption indicators and sustainability goals in Saudi factories?
How can the ROI of digital transformation be calculated in practice?
What are the main mistakes that reduce the reliability of Saudi factory KPIs?
How is Industrial IoT data translated into usable performance indicators?
See Riv-ERP in action
Two editions: RivDesktop on your own server, or Riv-ERP Cloud on Oracle Cloud.
Book a demo